By Mike Hennessy

The Platform Draws the Line
Observability on ECS Fargate splits along a boundary the platform itself enforces. Inside a task, containers share a network namespace and telemetry collection is straightforward. Across tasks, there is no shared filesystem, no label-based discovery, and no stable addressing. Those are two different problems and they require two different components.
This is how we built ours—without Kubernetes patterns that don't apply, without AWS-native lock-in, and without a dedicated log routing sidecar.
Why the Usual Answers Don't Work Here
AWS provides CloudWatch, Container Insights, and X-Ray. Each works in isolation. Correlating across them means stitching together systems not designed to operate as a unified whole—and none of it reaches Grafana, where we need it.
The standard OpenTelemetry answer is a DaemonSet collector. Fargate doesn't have nodes, so there's no DaemonSet. Tasks are isolated network namespaces with ephemeral IPs and no native service discovery. Log routing runs through FireLens rather than files on a host filesystem. The Kubernetes playbook doesn't apply.
The constraint that matters most is the task boundary. It's also the key to the architecture.
Two Components, One Boundary
The architecture has two components. A sidecar collector lives inside each ECS task and handles intra-task telemetry—traces, application metrics, Nginx metrics, and structured logs. A centralized Alloy-based collector runs as a small ECS service and handles everything the sidecar can't see: cluster-wide service discovery, infrastructure metrics, and platform logs. They're complementary by design. Neither is sufficient alone.
Inside the Task: The Sidecar Collector
Each ECS task gets a collector sidecar: a container running alongside the application and Nginx containers within the same task definition.
Containers in a task share a network namespace, so the application pushes traces, metrics, and logs to localhost:4318 without service discovery. From the application's perspective, the collector is always there and always at the same address.
The sidecar handles three distinct incoming telemetry streams.
Traces and application metrics arrive via OTLP from the application and Nginx containers. Nginx metrics are scraped directly by the collector over an internal port—no external Prometheus exporter, no separate sidecar, no port exposed outside the task.
Logs arrive via Fluent Forward or OTLP. ECS injects a managed FluentBit process when any container in the task uses the awsfirelens log driver, piping stdout using the Fluent Forward protocol to the collector. Application containers use the OpenTelemetry SDK for logging directly, which produces richer, more structured logs than the FireLens path.
Logs for the collector itself are sent to CloudWatch, where they'll be scraped by the central collector. This sidesteps a bootstrapping problem: if the sidecar fails, you still have its logs—routed through a path that doesn't depend on it being healthy.
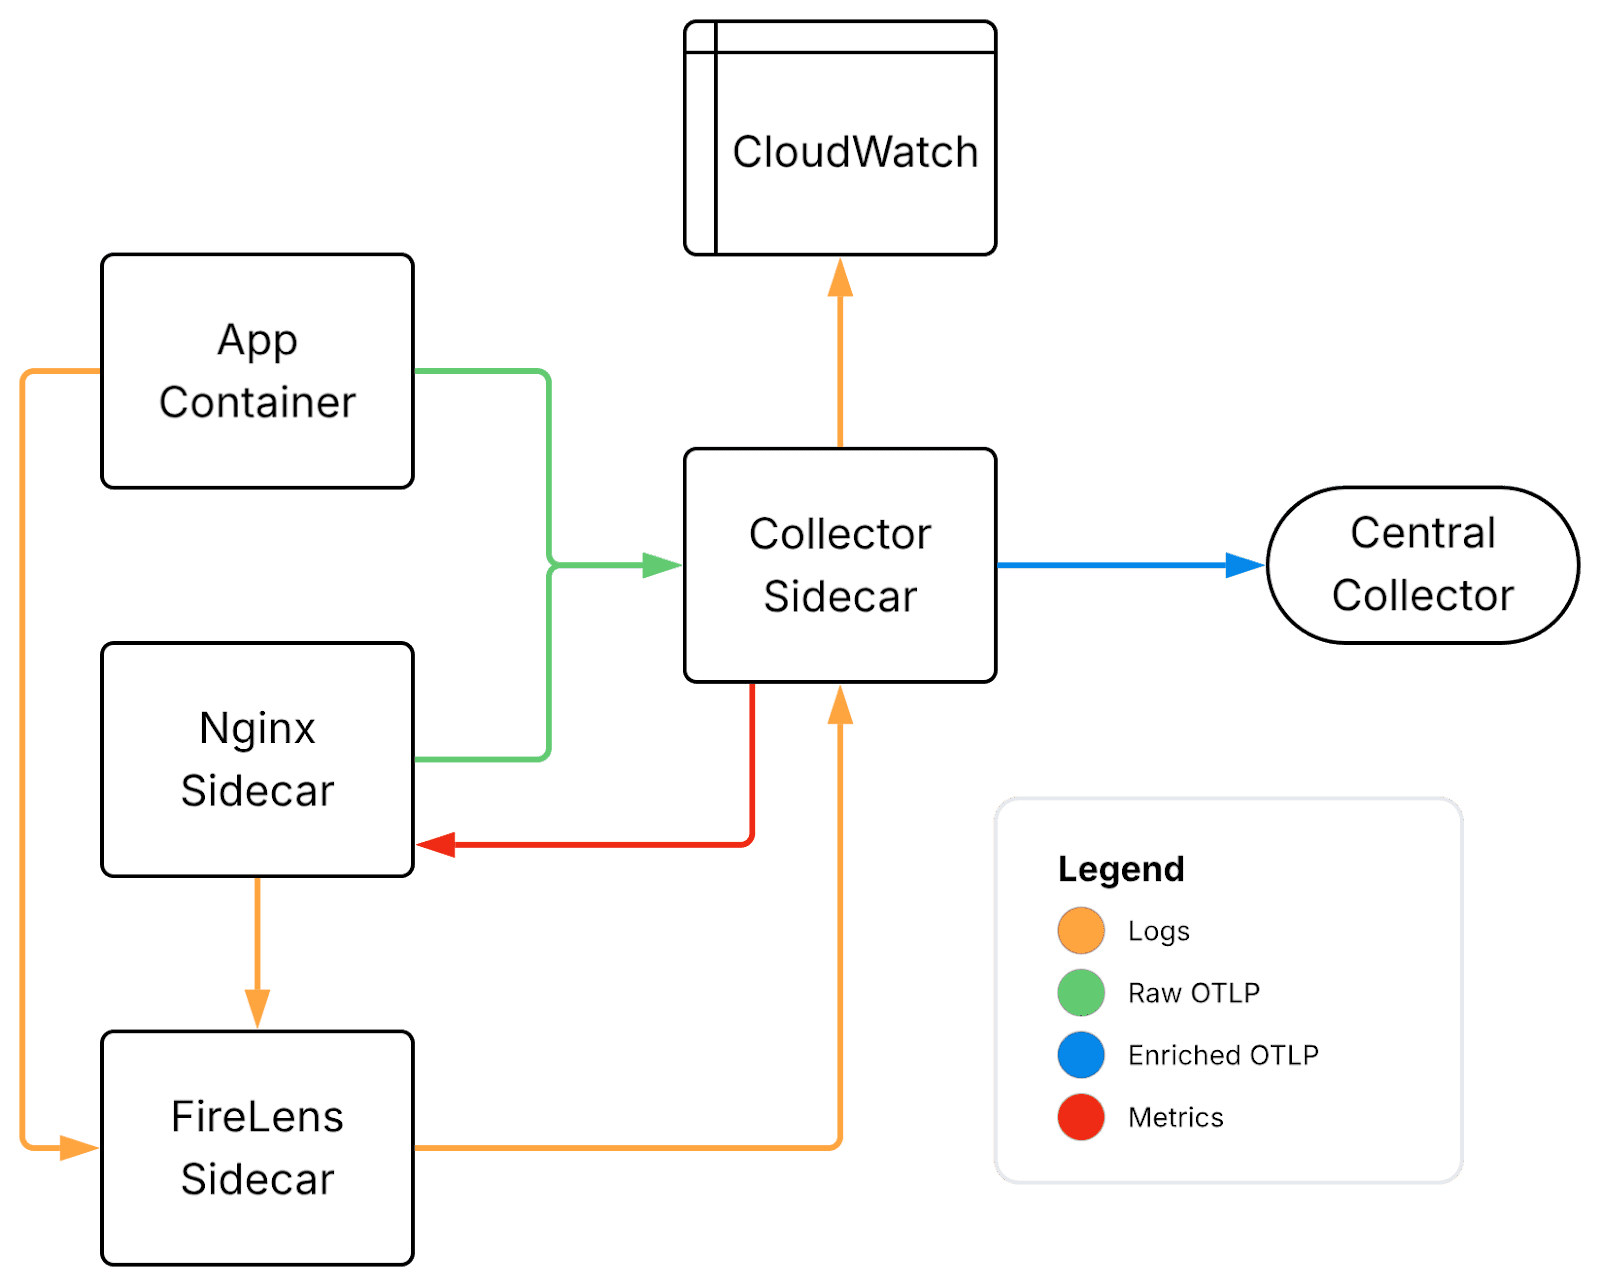
Each stream passes through processors that parse and enrich the data with task-specific metadata. The resourcedetection processor adds environmental context—task and cluster details, AWS account information. The transform processor handles log normalization: parsing JSON bodies, extracting trace context, mapping severity levels, and structuring Nginx access logs. By the time logs leave the sidecar, they carry the same resource attributes as the corresponding traces and metrics.
This only works because the collector is a custom-built image. ADOT doesn't include the fluentforward receiver or the transform processor. Building our own image removes the need for a separate log routing container and keeps all telemetry processing in one place.
Across the Cluster: The Centralized Collector
The sidecar handles intra-task telemetry. Everything else—service discovery, infrastructure metrics, and platform logs—lives at the cluster level.
We run a centralized collector using Grafana Alloy as a small ECS service, clustered for availability, with IAM permissions to call AWS APIs and read log groups.
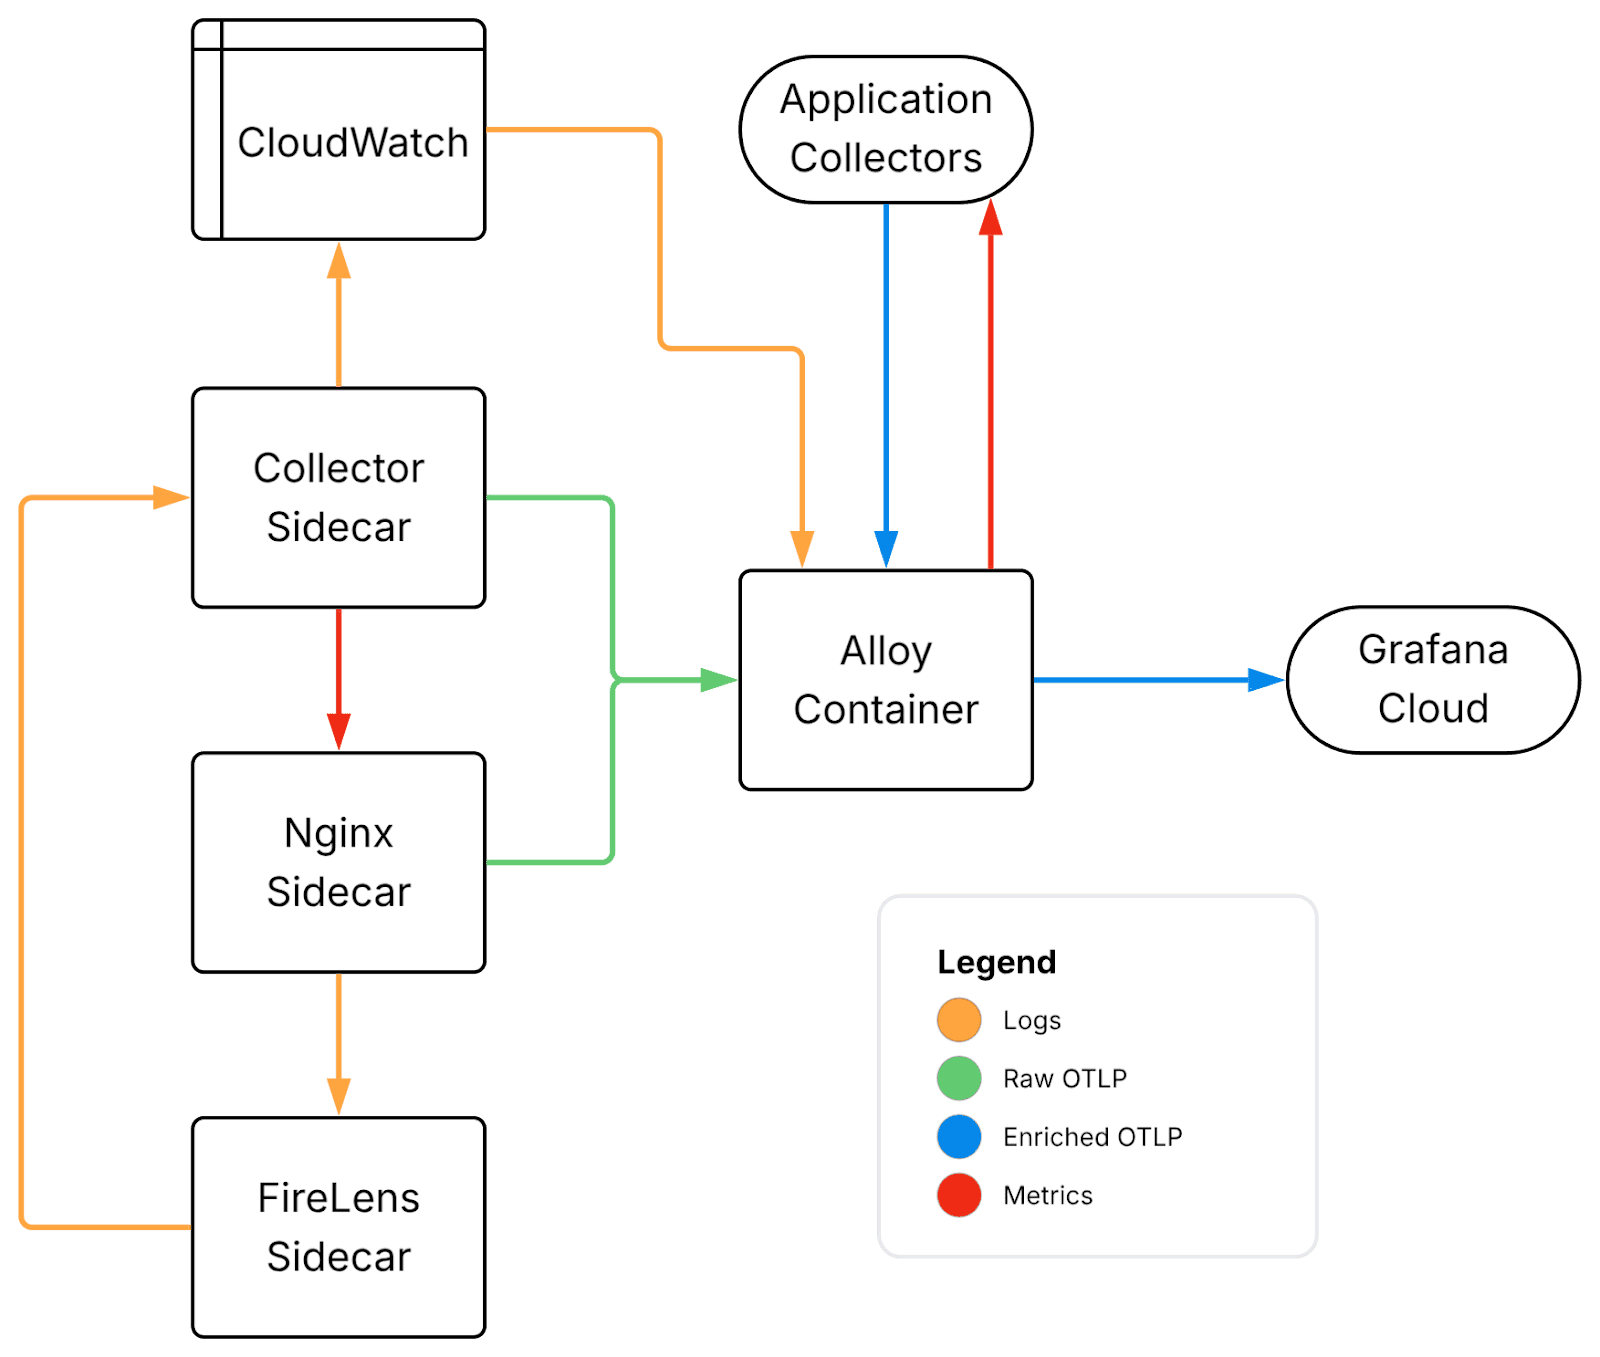
This collector uses the ecs_observer extension to poll the ECS API on a configured interval and maintain a live inventory of running tasks, their IP addresses, and the ports they expose. From that inventory, Alloy builds Prometheus scrape targets dynamically. Any task exposing a /metrics endpoint is discovered and scraped without manual configuration, and replacements are picked up automatically on deployment.
EC2 hosts are scraped separately. discovery.ec2 finds instances by tag, and Alloy scrapes their node exporters directly, bringing infrastructure metrics and container metrics into the same system.
Logs come from multiple sources. CloudWatch ingestion covers platform-level logs, while a Loki-compatible HTTP endpoint provides additional flexibility. Both flow through enrichment pipelines to add structure and metadata, alongside the structured logs arriving from the sidecars. The result is a unified log query surface across all sources.
A useful side effect of this aggregation layer is simplified archival. Logs flowing through Alloy are forked after processing: one path to Grafana for real-time use, another to S3 for long-term storage and data lake use.
Collector configurations are loaded from S3 at startup rather than baked into the image. This allows configuration changes without rebuilds, centralizes versioning, and opens a path toward dynamic reloads.
What We're Still Working Through
No architecture ships complete. These are the parts we're still not satisfied with.
CloudWatch log scraping is fragile. Polling log groups works, but it has rough edges. AWS Firehose provides push-based delivery and scales more reliably. Migrating away from polling is on the roadmap.
The Loki → OTel pipeline deserves more investment. Logs flowing through the OTel pipeline carry better structure and richer attribute models, which translates directly to a better querying experience in Grafana. Today the pipeline fans out to both Loki and OTel/S3, but the OTel path isn't the primary one yet. It should be.
mTLS across the collector layer is incomplete. Internal service-to-service communication uses mTLS with certificates issued by an internal CA powered by Smallstep, with short-lived certs rotated automatically via ACME. Extending this to the collector layer is still in progress.
Configuration management could be more dynamic. Loading a single config file from S3 at startup works, but Grafana's remote configuration system would allow updates to be pushed to running instances—enabling per-account configuration without monolithic configs or restarts.
AWS Eventually Agreed
The result is a unified observability layer across ECS Fargate—traces, metrics, and logs in Grafana, correlated, without AWS console dependency and without forcing Kubernetes patterns onto a platform that doesn't support them. The structural decisions have held up. Adding new signal sources means slotting into existing pipelines rather than redesigning anything.
In November 2025, AWS deprecated the X-Ray SDKs in favor of OpenTelemetry. X-Ray now ingests traces via OTLP rather than its own SDK. We arrived at that architectural direction well before the announcement. That's not a knock on AWS—it's confirmation that the underlying approach is sound.
The work that remains—Firehose migration, the OTel log pipeline, mTLS at the collector layer—is incremental. The boundary the platform draws is still the boundary we design around. We've just gotten better at working both sides of it.
Want to learn more? Click here to schedule a demo.